Infographics, Charts, & Diagrams
Infographics
Infographics need to communicate a bunch of information in a visual, easy to understand way. I have created many custom infographics, typically for use on websites or on presentations. I really enjoy creating these since they make information more accessible to the viewer. In the image above, I created an infographic for Stoplight’s website, which needed to demonstrate Stoplight’s relationship to other sites and capabilities.
Charts
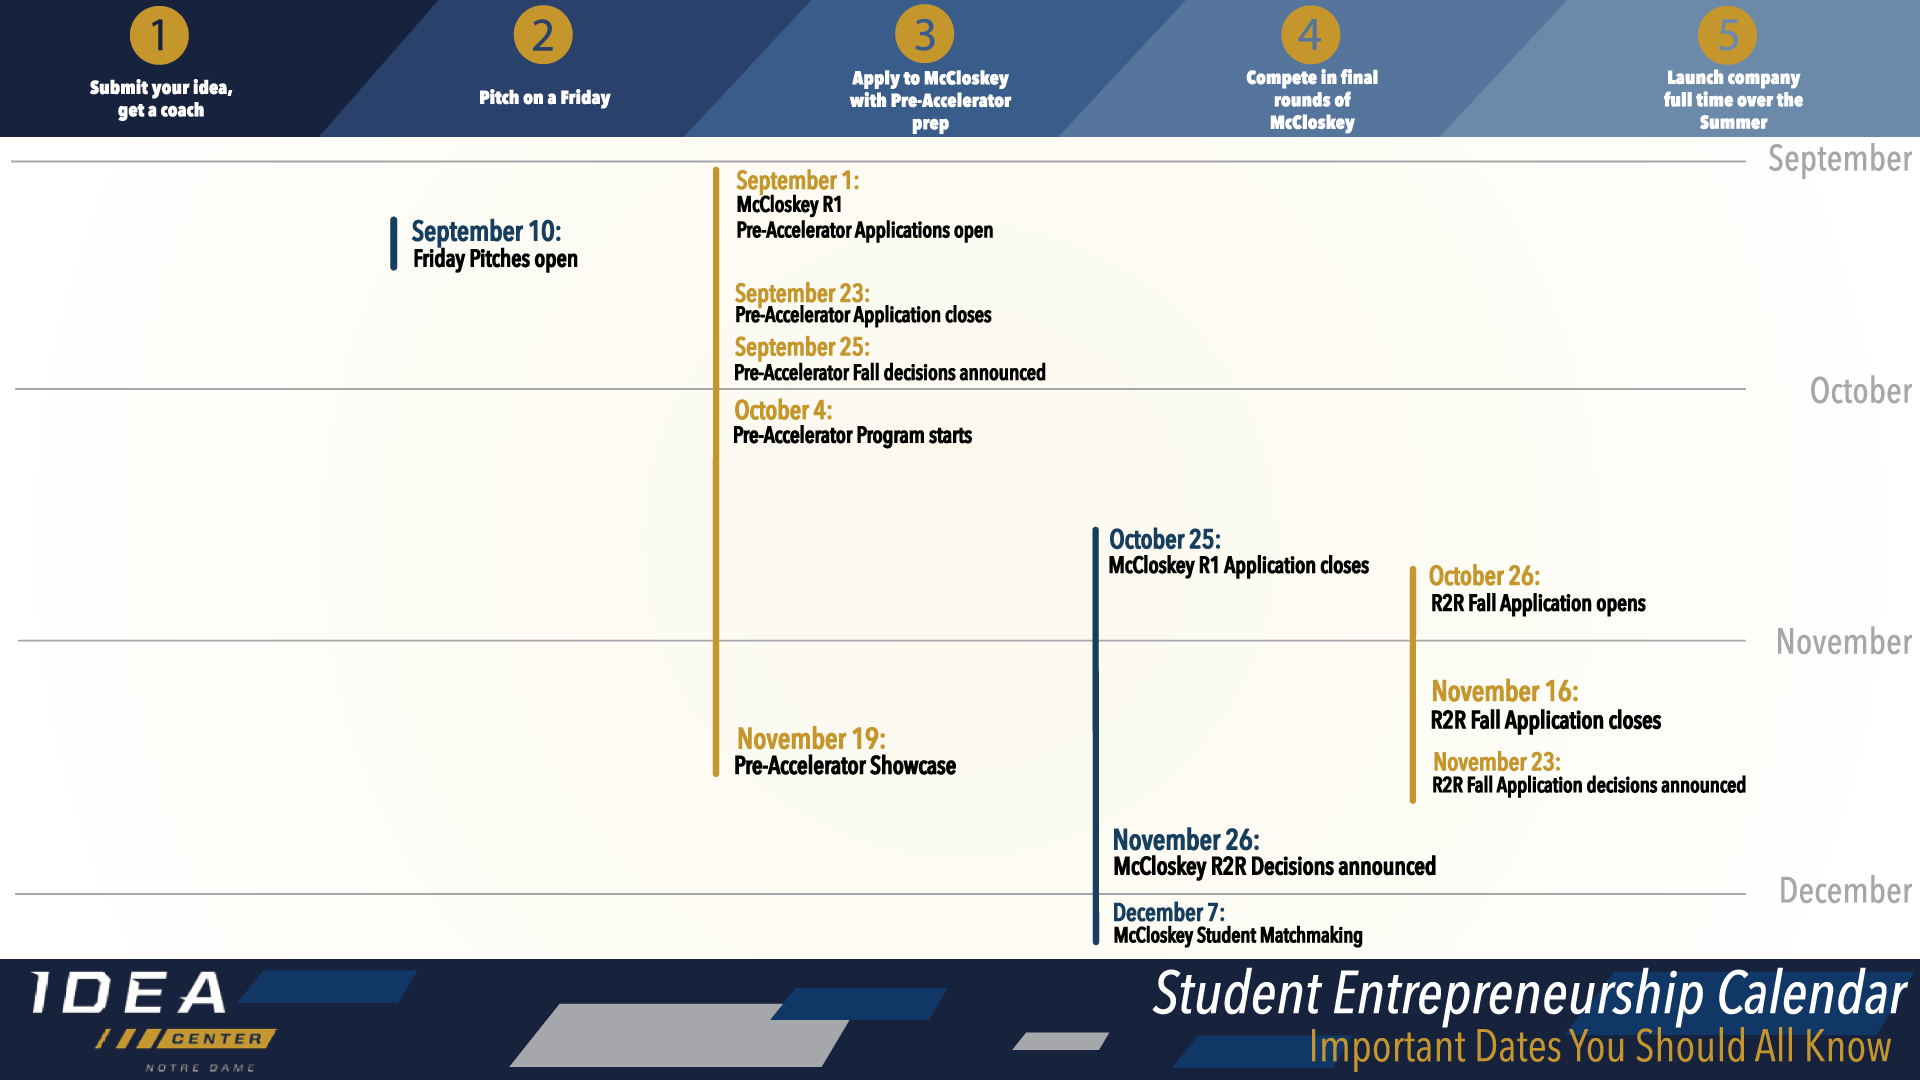
Charts outline information in a similar way to infographics, but, they typically give a more data or timeline driven message. In the example above, I created the design for a University program, in which there was a complex schedule that students needed to follow and understand in order to participate in the program. The image was also formatted to work as a powerpoint slide.
Diagrams
Diagrams depict instructions, products, or concepts in a simplified way so that the viewer can easily reference these images. I’ve created many diagrams for instruction manuals and product concepts. In the example above, I created a diagram for a service called “The Hang Up”. This service provided customers with a kit with everything they needed to create a gallery wall in their home: things like tape, picture frames, levels, etc. The diagram was meant to give them a multitude of layouts for which they could set up their gallery wall, and was included with the instruction manual.


